Monitor
The official JuiceFS provides client-side monitoring solutions.
-
Prepare juicefs-mounts-monitor.yaml``
juicefs-mounts-monitor.yamlapiVersion: monitoring.coreos.com/v1
kind: PodMonitor
metadata:
name: juicefs-mounts-monitor
labels:
release: kube-prometheus-stack
spec:
namespaceSelector:
matchNames:
- storage
selector:
matchLabels:
app.kubernetes.io/name: juicefs-mount
podMetricsEndpoints:
- port: metrics
path: '/metrics'
interval: 10s -
Apply
kubectl -n monitor apply -f juicefs-mounts-monitor.yaml -
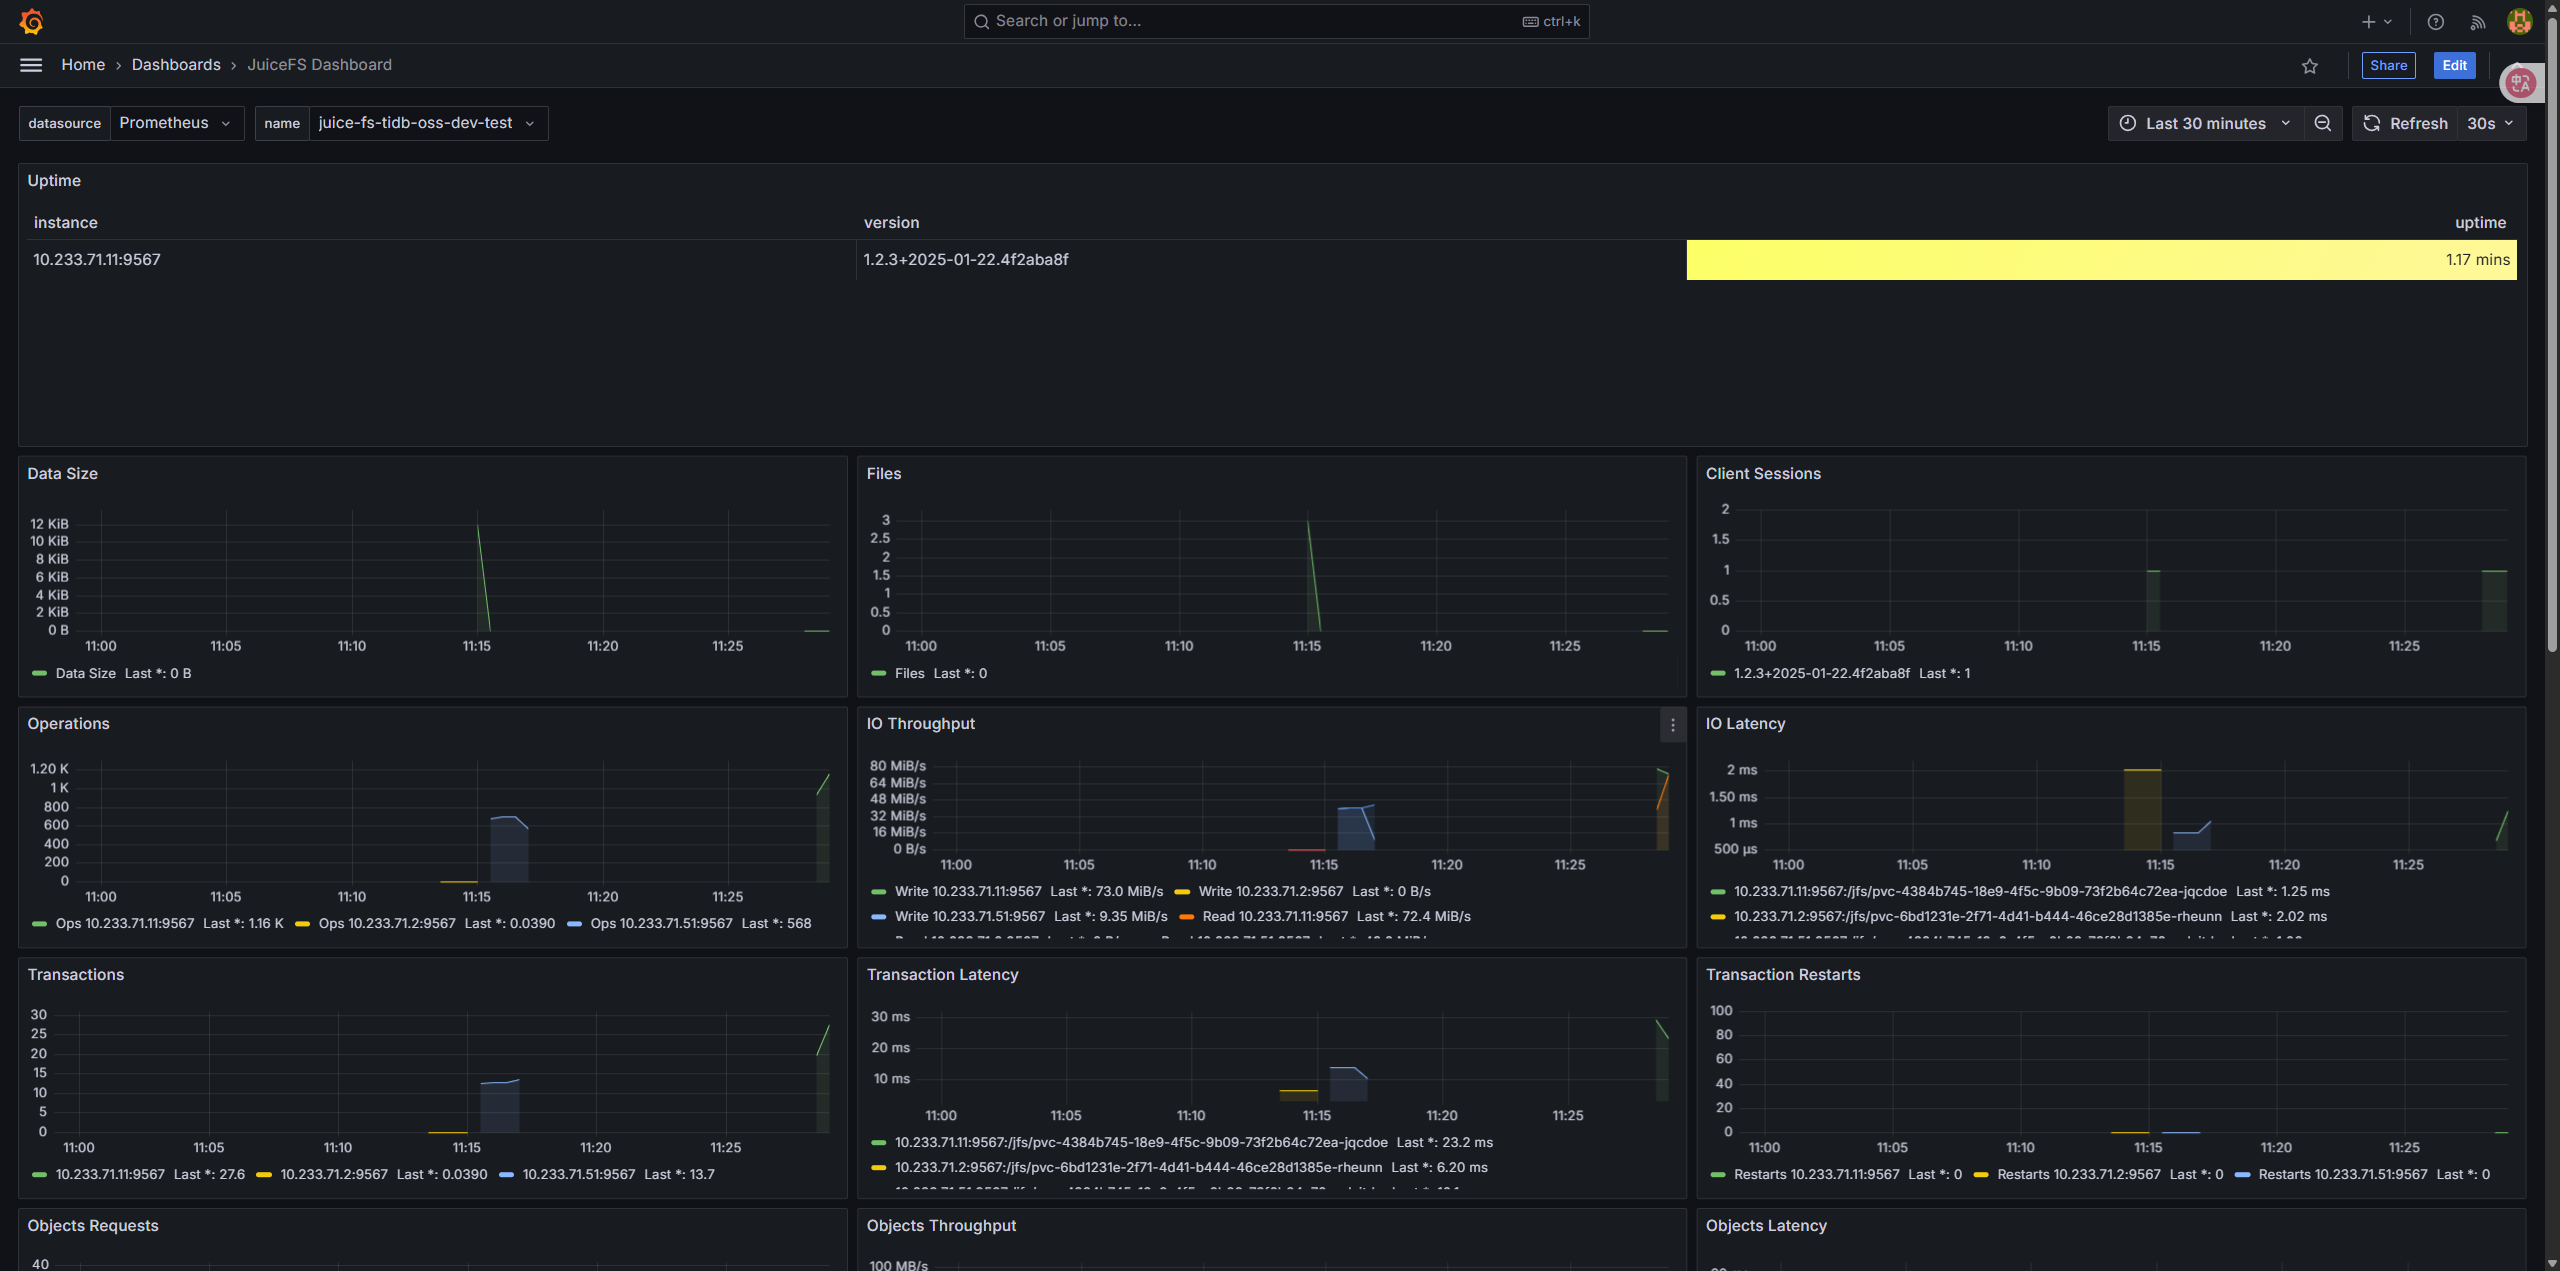
Import dashboard
The official JuiceFS-maintained dashboard templates can be found in the Grafana Dashboard repository. You can directly import them into Grafana using the link https://grafana.com/grafana/dashboards/20794/ or by searching for ID 20794.